06. Develop a trigger system

Summary

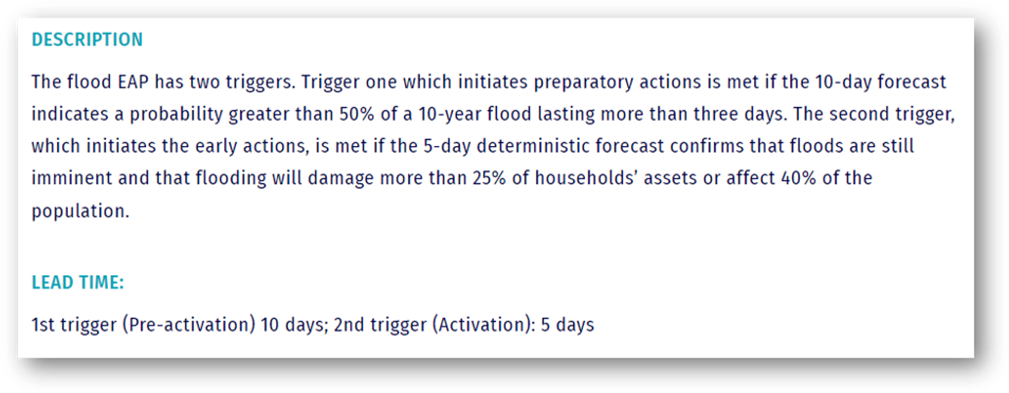
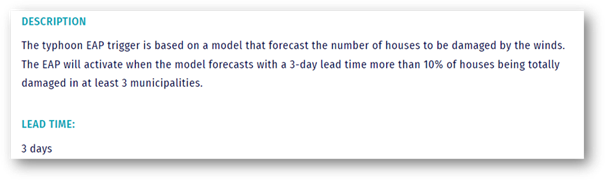
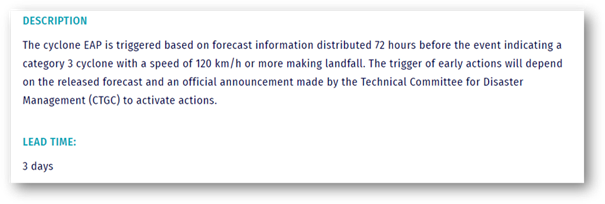
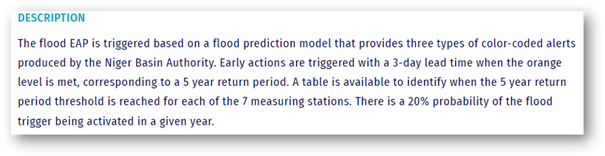
The trigger is one of the key components of FbF (in addition to the early actions and the financing mechanism) that will guide the national society to when and where early actions need to be implemented. When a pre-agreed threshold of a forecast is reached, the national society activates its (s)EAP and funds will be automatically dispersed.

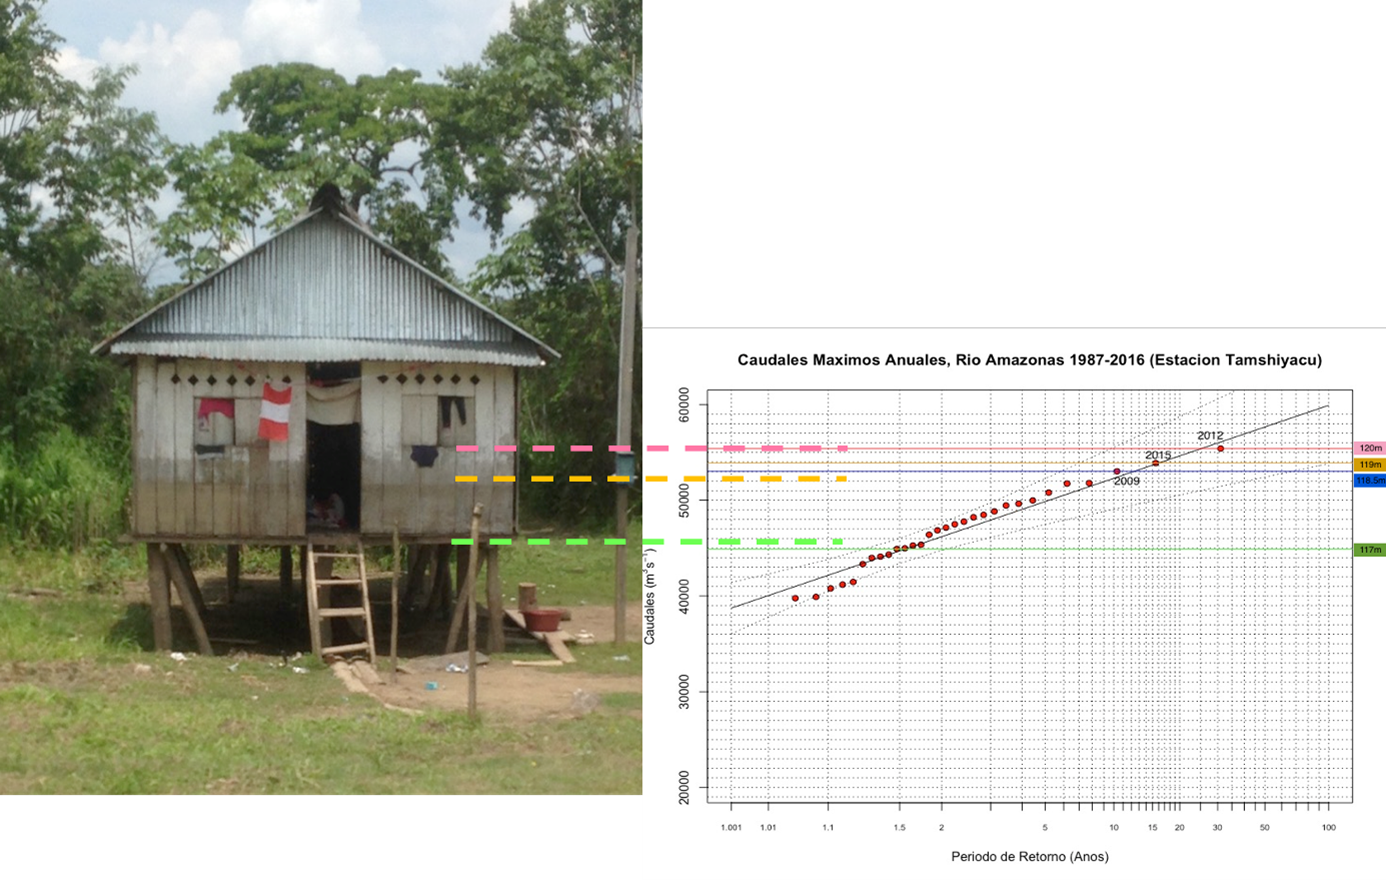
FbF is designed for those events that are predicted to have a severe humanitarian impact, therefore, it is not enough to know what the forecasted windspeed will be. Instead, you must know whether the storm will cause humanitarian impact. For this reason, the development of the trigger requires an understanding of past impacts that can be related to a certain hazard threshold, e.g. windspeed.

The methodology elaborated below can be applied and adapted for a variety of hazards. It is derived from work on weather-related hazards, such as floods, storms and droughts, but it can also be adapted to non-weather hazards, such as epidemics or locusts, if appropriate.

This chapter will guide you through the trigger development process from a technical perspective. It will also advise you on technical cooperation and share examples and good practices.

Please note that the development of the trigger system runs in parallel with the selection of the early actions, as the development of the EAP in an iterative process. For example, if the action is “evacuation”, you would select a different triggering forecast than if the action is “spread awareness about cholera risk”. Thus, some steps from chapter 7: Select your early actions are needed to advance with the trigger development.

In the video below, Catalina Jaime, expert on anticipatory action, climate and conflict, explains how to build upon a feasibility study, and complete a risk analysis.

Step 1: Select hazard

If not done during the scoping study, you need to decide which hazard you will address with your FbF system. In the EAP you will be asked to provide a brief rationale about the selection of the hazard and when it has caused various humanitarian impacts in the past (Section 3.1 in full EAP). This should include:

  • A table that outlines the most severe events of this hazard in the past (see a simple template in the toolbox).
  • A written description of what the impacts of this hazard were, who was affected and why, how many people were affected, and what were the main sectors affected

Please refer to chapter 5: Collection risk, early action and impact data to learn more about the data collection of these information.

Step 2: Understand what needs to go in a trigger system

A trigger system will allow the national society to know when and where to act. Please verify the (s)EAP quality criteria for the trigger and the EAP activation system that are linked in the toolbox below. For FbF, you need to include three components of an operational trigger system:

Step 3: Establish coordination mechanism

In order to ensure sustainability and alignment of the trigger system, it should ideally be embedded in the national early warning and alert system. At the very least, key actors should be involved in or endorse the trigger development process and its outcomes. Generally, trigger development can be a very technical process, hence cooperation with meteorological services, disaster management authorities, and other experts and institutions that work in the field is necessary. To begin with, you can think about the following aspects that might also shape your advocacy strategy (please refer to chapter 2: Engage your stakeholders).

Mandates
Who has the mandate to issue forecasts and early warning messages? Ensure that you are in line with the official regulations and procedures. In many cases, the meteorological service has the mandate to issue forecasts and issue early warning messages together with disaster management authorities. This is done to avoid confusion, which could happen if there were many groups issuing their own alerts.

Existing initiatives
In many cases, the national meteorological agency is already involved in initiatives around impact-based forecasting or anticipatory action. For example, in Mozambique the government partnered with the World Food Programme (WFP) to develop harmonised drought triggers that are owned by the government. If such early warning mechanisms already exist, you should tap into those to avoid a duplication of work. Perhaps there are existing agreements, MoUs, or trigger activation systems already established.

On the regional level, technical working groups also shape the anticipatory action landscape and thus trigger development. There are several examples in Africa, but also in Latin America and Asia Pacific. Please find an overview of the regional technical working groups here.

Technical standards in the Asia-Pacific region

As anticipatory action is gaining momentum in Asia-Pacific, there is a growing demand for coherent terminology and approaches to building an anticipatory action system. Recognizing the need, the Asia-Pacific Technical Working Group on Anticipatory Action (TWG AA) has collectively developed Technical Standards on Anticipatory Action in Asia and the Pacific through a consultative process with its members. The document draws upon the definition and three key building blocks set out in the ASEAN Framework on Anticipatory Action in Disaster Management.

https://www.anticipation-hub.org/Documents/Manuals_and_Guidelines/TWG_AA_Technical_Standards_on_AA_in_Asia-Pacific.pdf

Guiding questions to establish a coordination mechanism:

  • Who are the key actors issuing forecasts and early warning messages?
  • Are there existing initiatives on anticipatory action, such as technical working groups?
  • Are there existing agreements or risk information systems that could be used for any of the three parts of the trigger system (trigger statement, intervention selection, and trigger monitoring and activation system)?
  • Is there political will within the government to own and maintain the trigger monitoring and activation system?

Step 4: Define hazard variables to monitor based on impacts and early actions

In order to understand which forecast(s) would be most suitable for your trigger, you need to understand the impact it should forecast. For example, when talking about impacts of cyclones you need to understand what has caused the impact: the winds, the rains or the storm surge? Hence, here you need to review the work that you have done on impact analysis and potential early actions. Please refer to the guidance in chapter 5: Collect risk, early action and impact data and chapter 7: Select early actions regarding the prioritisation of impacts and early actions.

Hazard Cascading hazard Potential primary and secondary impacts Variable and drivers
Heavy rains Riverine Flood - Landslides Damaged houses - Damaged crops - Livestock dead - Cholera outbreak Water level - Flood extent
Cyclone Damaged houses - Damaged crops Wind speed - Strong rains - Cyclone-induced floods - Storm surge
Drought Agricultural droughts - epidemics Death of livestock due to insufficient pasture - Crop failure Vegetation condition - Rainfall - ENSO

Guiding questions to define hazard variable

  • Which impacts were prioritised?
  • What has caused the impact?
  • What variable can be used to best forecast the prioritised impact?
  • How much lead time is needed to implement the early actions? What early actions would be feasible in a given lead time?
  • Can this variable be forecasted with the needed lead time?

Step 5: Compile a menu of forecasts

In order for FbF to allocate funding when a trigger occurs, there must be a certain probability of the event. To safeguard this, it is crucial to select the best-suited forecasts. An analysis of forecast verification, type, reliability, lead times, and sources of data for forecasts should be presented as an inventory, to allow an informed decision about which one to use.

Note that this information does not need to be analysed or calculated by the national society but can be obtained by working with hydro-meteorological services, research institutions, or other experts.

Guiding questions:

  • Which agency produces relevant forecasts on national, regional or global level?
  • What kind(s) of forecast(s) are produced or how is the forecast produced? Tip: Choices include observed data (e.g. gauged precipitation), statistical forecasts (e.g. extrapolation of an upstream river flow to a downstream location, or an index based on El Niño sea-surface temperatures), and dynamic models (e.g. numerical weather-prediction systems and large-scale hydrological forecasting models). Check the toolbox for more information.
  • What outcome is the forecast forecasting? E.g. seasonal total rainfall, flood levels, windspeeds.
  • Is the forecast deterministic (showing a single outcome without conveying potential error and uncertainty) or probabilistic (showing the probabilities of one or more discrete outcomes or categories) or issued as an interval (showing an explicit upper and lower limit between which a value is expected to occur)?
  • What is the spatial (e.g. what is the level of detail?) and temporal (e.g. how often is the forecast produced in a month?) resolution of the forecast?
  • What is the lead time for each forecast, e.g. what is the time between forecast issuance and the shock?
  • What regions are covered by the forecasts?
  • What is the skill (the quality) of the forecast? How has the skill been assessed (e.g. skill at a specific location, skill at predicting extreme events)?
  • Is the forecast available throughout the year? Does the accuracy/skill of the forecast change over time?

The menu of forecast required in the full EAP (section 4.2) requests to provide the following information about the available forecasts (or other relevant early warning and/or monitoring/surveillance systems) and requests to include an explanation about which forecast will be used and why.

  • Name of forecast
  • Source
  • Lead time
  • False alarm ratio and missed events
  • Number of times the forecast has been issued for this hazard in the last 10 years

You can download a template for the menu of forecast table and a more comprehensive guide on forecast verification or skill analysis in the toolbox below.

Menu of forecast and skill analysis for the simplified EAP

For the simplified EAP a less-thorough assessment can be done. The rationale is that perhaps there is less data available to assess the forecast skill which is particularly true for non-weather-related hazards. However, if data is available, information should be included as you want to avoid false alarms or missed events that will jeopardise the reputation of the National Society but also the mechanism of FbF.

Step 6: Set impact threshold

Generally, the purpose of the DREF is to fund humanitarian operations by national societies. Hence, the anticipatory pillar of the DREF provides funding for anticipatory action for events of a strength that have caused significant humanitarian impact in the past. In order to demonstrate that the selected hazard has caused humanitarian impacts in the past, information on the previous impacts of the selected hazard in the country should be provided. Please revisit chapter 5: Collect risk, early action and impact data, if you still need to collect impact data.

Guiding questions

  • From your impact assessment, which years show humanitarian impact, e.g. because a significant number of people was affected, a significant number of houses destroyed?
  • In which years did the National sSociety respond to a hazard, e.g. with a DREF but also other humanitarian funding?
  • Which years or events were perceived as disastrous by communities, branches, experts or other stakeholders?
  • When was a disaster declared for the selected hazard?

The discussion should result in a decision at what impact level you would want to activate your EAP. For example, you could use reference events stating that you are targeting events like a cyclone with windspeeds greater than a certain amount, which happened in the past in your country.

Note that both EAPs (full and simplified) target the same type of events: those that have caused humanitarian impact in the past. The return period of the event, e.g. of five years can be used as a rule of thumb if there is a lack of data. However, in the EAP this will usually not suffice but you need to show that the suggested magnitude has caused humanitarian impact in the past. Exceptions are cases where only really little data is available.

The full EAP (section 4.3) asks you to do the following:

  • explain why you selected a certain magnitude of the event,
  • how your impact level was defined,
  • how much impact can be expected based on the strength of the event,
  • indicate to which return period the selected impact level corresponds

Why does FbF target only events that have caused humanitarian impacts in the past?

FbF or anticipatory action is not the silver bullet to solve all challenges in disaster risk management. FbF aims at managing residual risk that cannot be addressed by long term investments in disaster risk reduction. For example, in a flood prone area you would rather try to build a dyke or put houses on poles if the houses are flooded on an annual or bi-annual basis than setting up an FbF system for those recurrent events. On the other hand, you are unlikely to have enough funding to build a dyke so high that it will also reduce the risk of a major flood. FbF can be critical to evacuate people and their livelihoods before that kind of major flood.

Setting impact magnitudes

The image can help in explaining which events we target with anticipatory action and FbF . You can see that people can cope with recurrent floods (green line) by building their houses on poles. Stronger events (orange and red lines) that occur less often will then also have impact and require action, e.g. evacuation of people and their assets.

Step 7: Link impact and hazard magnitude

After having defined what magnitude of impact you want to target, you need to link the impact magnitude with the hazard magnitude, e.g. estimating what windspeed would cause houses to be destroyed. Depending on your availability of data (both impact and hazard), you can simply plot historical events on an x-y axis, with the hazard magnitude (e.g. windspeeds) on the x-axis, the impacts (e.g. houses destroyed) on the y-axis. This is called a “hazard-impact curve” and can help you decide at what level of hazard would be important to use as your trigger, because you know it causes substantial impact.

Approaches to hazard-impact curves

Example 1: Philippines Floods – Simple - Impact data
For floods in Philippines, the analysis of a lot of impact data, such as the price drop of rice crops depending on their reproductive stage and the percentage of crop loss on municipal level that is considered critical in a 5 year return period event are taken into account, depending on the flood level. The Philippines are employing a very impact data driven approach
Example 2: Ecuador Volcanic Ash - Expert estimation
In Ecuador, the impact of volcanic ash is categorized into three main areas: crop loss, damage to livestock, and health effects on people. Estimated impacts for each category are determined by the quantity of volcanic ash present in the region. As a result, three distinct and practical levels of impact have been clearly delineated, providing a structured framework of thresholds. It's important to note that this model relies heavily on expert opinions, with less reliance on empirical and experimental data.
Example 3: Bangladesh Cyclone – Vulnerability data crossed with historical data
In Bangladesh the impact on houses is prioritized, therefore several factors are combined, such as the distance of houses from the coast, the proportion of kutcha and semi-pucca houses and the wind reduction factor to estimate the damage of a certain wind-speed to these houses. This information is crossed with historical data about house destruction. When a storm approaches, the forecasted wind speed is transformed into an exposure map. This map, combined with impact curves, estimates the percentage of houses likely to be affected by the forecasted storm. The result is a map highlighting the percentage of houses at risk of destruction within each union in the exposed district. Priority for intervention is assigned to unions where more than 25% of rural houses are potentially damaged.
Example 4: Mongolia Dzuds – Prior Events
In Mongolia not a lot of data is available on both the forecast and impact aspects, making it difficult to draw definite conclusions about the level of impact. The action threshold defined in the trigger section is derived from analyzing the limited data available for the past few years. It represents our best estimate to identify years when the herder population and provincial government may find it challenging to safeguard herder livelihoods from substantial losses.

Step 8: Define and justify trigger threshold and forecast variable

After having analysed the link between impact and hazard magnitude you should be able to determine and justify the level of impact and the corresponding hazard magnitude at which you want to trigger your (s)EAP. Hence, the output of this step should be a threshold of a given forecast variable and its justification. Two more aspects are specifically mentioned in the full EAP criteria:

  • Frequency of the threshold being reached: Please show in which years (if the data allows) you would have reached the trigger and what is the frequency of the trigger being reached
  • Return period of the event and how the return period was calculated: As mentioned above the return period of five years just serves as a rule of thumb. Still, you are asked to provide the return period of your trigger to avoid that you are triggering your s(EAP) on an annual basis.

Dynamic or flexible triggers

Triggers are very useful when pre-agreed. Moreover, most of the triggers in EAPs are static which means the threshold is set on one specific value, e.g. windspeed of 120km/h. However, what if the reality doesn’t follow your plan, e.g. the very same region is hit by a cyclone again, we have consecutive drought years or communities are more vulnerable because of conflict outbreaks and even a small flood will have huge impacts? This could be addressed by more flexible or dynamic triggers that take into account changing vulnerabilities and contexts.

Impact-based forecasting

The idea of impact-based forecasting (IBF) is to predict what the weather will do and not what the weather will be. However, IBF requires substantially more data than only weather forecasts, e.g. meteorological data in combination with risk information.

Please find a guide to impact-based forecasting in the toolbox.

Step 9: Define stop mechanism (if applicable) 

For (s)EAPs with a lead time longer than 3 days a stop mechanism is required. A stop mechanism stops the activation of the EAP in case there is a significant change of the forecast, and the threshold is no longer reached or in a different location. Hence, the stop mechanism should include the description of what the national society would do if the forecast changed in strength or location within the last days before the event. That means that also actions need to be planned so that they can be stopped at the point of the stop mechanism.

Bangladesh Flood EAP

In the trigger statement of the Bangladesh flood EAP, you can see that they introduced a 10-day pre-activation trigger in which they start to pre-register families. However, only when the 5-day activation trigger is met, the early action is implemented. If the 5-day trigger is not reached or confirmed, the activation and thus the early actions will be stopped.

Step 10: Develop a trigger statement

The trigger statement is a key component of the full and simplified EAP (section 4.1 in the full EAP) and it should exactly state when your EAP will be triggered. The trigger statement should be clearly understood by all stakeholders involved in order to avoid confusion about when a trigger is reached. Please review the trigger data base on the anticipation hub for examples.

A trigger statement typically includes the following ingredients:

  • Forecast used and forecast source: The forecast used and forecast source should clearly state which forecast, e.g. a certain rainfall forecast is being used and from what source, e.g. national meteorological service
  • Variable: the variable should clearly state which variable of the forecast is being used. Hence, this should be an indicator such as Standardised Precipitation Index (SPI3) or heat index, or water levels at a specific station.
  • Threshold of that parameter: Here you put the threshold that you have identified in the previous step. Make sure that your forecast provider is calculating this threshold (e.g. if the forecast is issued in mm of rainfall, but your trigger is in SPI, who will calculate the SPI?).
  • Lead time: The lead time defines when the conditions must be met for the anticipatory action to be effective. This helps ensure that interventions are timely and proactive.
  • Probability: If available, you should add the probability of the event to happen. For example, the trigger could be a forecasting showing 80% chance or greater of 30mm of rainfall or more.
  • Stop mechanism: If your EAP has a stop mechanism it should be mentioned in the trigger statement
  • Monitoring system: You need to decide how your forecasts are monitored and who is responsible for this. We will elaborate this further in chapter 8.

Examples of trigger statements

  • Philippines

  • Mozambique

  • Niger

A complete trigger statement can look like this:

When the [Source of information] forecasts [Threshold of climate variable OR Threshold of impact] at [Lead time] and with a [measure of probability], actions will be taken. If [stop mechanism] occurs, activities will be paused. This system will be monitored closely by [Monitor] in the following way [System].

Staggered or phased triggers

In order to win valuable time, some national societies have introduced phased or staggered triggers. That means that they have a pre-activation trigger and an activation trigger. The Bangladesh example above introduced a phased system to their flood EAP. They use a pre-activation trigger at day -10 to pre-register households and get some logistics ready, to then be ready to implement their actions, e.g. cash distributions at day -5. This gives them valuable time as without the readiness trigger, the actions could not be implemented in the short lead time.

Note that funds are only allocated from the IFRC once the activation trigger is met. If funds are needed during the phase between readiness or pre-activation trigger and activation trigger, the national society has to find them or need to account them in the annual readiness costs of the EAP.

Combination of forecasts for drought

In some cases, a combination of different forecasts and variables might be needed. As drought is a relatively new hazard for anticipatory action in the RCRC movement not much guidance existed at the beginning. In a validation committee meeting in 2023 the members suggested to combine different forecasts in drought triggers. The rationale is that rainfall forecasts alone will not suffice as they do not give any information on the impact (due to the time lag and also the timing of rainfall and its impacts on vegetation). Hence, rainfall forecasts should be complemented with measures of vegetation condition, food security or any other measure that reflects the prioritised impacts.

Step 11: Develop a mechanism that defines the intervention area

Once you receive information about the trigger being reached you should also know in which geographic regions the trigger is reached. You should then know how to prioritize the municipalities and where to intervene. Note that you and the national society will probably not have the capacity to act in all municipalities and support everyone, hence you will need to prioritise in a transparent mechanism. The full EAP criteria state:

There is a map or a clear methodology that will tell the national society where action should be taken based on a combination of vulnerability, exposure, and the forecast, when the EAP is activated based on the trigger model. (Section 4.4 in full EAP template)

Currently there are two main ways to define the intervention area:

Impact based forecasting

In case you have an impact-based forecasting system, it should tell you which locations might be most affected. For example, if your national society has the capacity to act in three municipalities you can select those three municipalities that are forecasted to be most affected.

Indicator-based risk assessment

If you don’t have an impact-based forecast, you can use a regular weather forecast and overlay this with exposure and vulnerability information. This can serve as a proxy to predict where impacts will be highest. The simplest way to do this is to use an indicator-based risk assessment by using the vulnerability and exposure indicators that you have identified in your risk assessment (see chapter 5: collect risk, early action and impact data). This method is used in most EAPs so far.

There is a variety of methodologies to do indicator-based risk assessments. However, the most prominent one is probably the INFORM Risk Index methodology.

Example: Drought trigger development in Somalia

For the FbF project in Somalia a whole workflow was developed in QGIS for the trigger which is owned and run by the Somali Red Crescent Society.

For the development of the Somaliland-Somalia Drought Trigger mechanism various datasources were thoroughly analysed. Finally, the main parameters chosen for the trigger based on the historical impact assessment are the twelve month Standard Precipitation Index (SPI12) and the IPC acute food insecurity classification. The exact data used are the documented and forecasted SPI12 (source: ICPAC) and the forecasted IPC classification (8 month forecast, source: FEWSNET), that is used to calculate a population weighted index of food insecurity. The trigger thresholds for both components were optimised towards the most favourable proportion of hit rate and false alarm rate. The emerging thresholds were <-1 for the SPI12 and >=0,7 for the IPC based index. The triggering is done on district level and per district just one trigger initiation per year is possible.

This information of the threshold is then overlaid with an indicator-based risk assessment which identifies the most at risk disctricts.

QGIS Trigger Workflow for Somalia

There is no defined methodology to derive the intervention map. Hence, if you have another established methodology, please only make sure that you explain it well in the EAP document.

Toolbox